Can you find revenue by measuring application performance and improving the end user experience?
If you are like half of the companies that call us in to talk about their Citrix environment, one of the common complaints we get from end users is that “Citrix is slow.” The same argument is common for VMware View deployments as well.
At first glance this is an end user experience problem with no real business impact. Look a little deeper into the research and interesting statistics start to reveal themselves, like this one reported by the Aberdeen Group that 50% of businesses are losing revenue due to poorly performing applications1.
A poor end user experience can directly impact company revenue.
Citrix relies on 11 key areas of the infrastructure to deliver optimal application or desktop performance. If any of those systems are out of whack, the end user experience will almost certainly suffer.
Until recently, comprehensive monitoring and management tools that can pro-actively measure the full end user experience, application performance and correlation analysis did not exist. Aternity’s Frontline Performance Intelligence (FPI) addresses this revenue eating blind spot by providing full visibility into application performance and the ultimate end user experience.
Aternity’s FPI platform is not confined to Citrix, VMware or Microsoft environments. Aternity’s pro-active analysis capability can provide application performance and end user experience metrics on almost any edge device, including smart phones.
Is your cellular signal or that Starbucks wireless access point impacting application performance and your end user experience? Aternity FPI can tell you.
Let’s take a look at what Aternity feels are the real issues for the user at the workstation level.

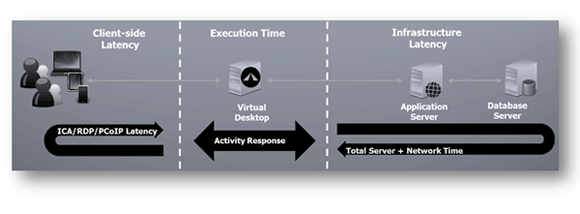
There are three key areas that comprise response time to the user:
- Client-Side Latency. This is the network transmission delay, plus the amount of time required for the workstation OS to interact with the Citrix client and the display protocol (ICA in Citrix’ case) to complete the display of a response from the host servers once it arrives at the workstation. Aternity has determined that anything over 1.3 seconds for this delay starts to become irritating for the user.
- Execution Time. This is the amount of time required by the XenApp server or XenDesktop VDI session to process the request from the application that the user has entered.
- Infrastructure Latency. This is the amount of time required for any application servers and/or database processes to service the request.
Adding up all of these delays, you get the total response time for the user. Aternity FPI automatically formulates a baseline for each user in the environment, or you can make adjustments manually. Gone are the days where one baseline is established for all users. Now baselines are set on individual criteria like user location or type of edge device, for example, so offices that are farther away, have slower connections or have end users on older PCs get baselines that make sense for their unique environment.
Aternity FPI monitors each individual user, measuring the performance and response of every accessible application, now including SaaS applications as well. Digging deeper, Aternity can capture metrics for specific business processes within an application that can help IT optimize the user experience and Line of Business executives optimize productivity.
Aternity will monitor the applications, establish benchmarks and create alerts when performance is off baseline by whatever percentage you select. If an abnormality is detected, FPI will give you gobs of information and correlation to help lead you to the correct cause of the problem.
Here are just a handful of the ways that you can slice the data and measure performance:
- By user or group of users
- By device type and OS level
- By OS patch level
- By location
- By server providing the session
- Network performance in total and by location
When users are impacted by a slowdown and pushed off baseline, Aternity sends a repair ticket to your ticketing system, if configured; giving Help Desk personnel an opportunity to be proactive and get ahead of issues before end users start calling.
When all is calm again and you are ready to do an autopsy of a particular issue, Aternity will let you go back in time and pick a particular user or device and get a snapshot in 1 minute intervals as to exactly what was happening inside that device with response time, with RAM, with CPU, and more. Very powerful.
End users often complain and blame Citrix for slow boot times. To tackle this problem head on, Aternity includes Boot Profiling in FPI.

The Boot Profiling capability applies the same FPI analysis, baselining and optimization techniques to the workstation boot process. Boot Profiler will optimize the boot process through compression and more efficient execution to get the boot process to its minimum. Going forward, it will monitor the “time-to-boot” with each boot. If the process takes longer than the norm, the correlation engine will attempt to identify the root cause.
Better performance leads to a better end user experience and potentially more revenue. In a separate study, the Aberdeen Group found that application performance issues can impact corporate revenues by as much as 9%2.
Aternity FPI helps Whitehat see application performance problems and what is ultimately impacting the end user experience in real time. According to Aternity, FPI identifies the root cause for IT more than 60% of the time before the user is even aware there is a problem. How valuable is that? At least 9% of revenue, right?
1Aberdeen Group (2008) “Application Performance Management: Getting IT on the C-Level’s Agenda”
2Aberdeen Group (2008) “The Performance of Web Applications: Customers are Won or Lost in One Second”


Leave Comment